Pharmacy Analytics
The Clinical Analytics Pharmacy Analytics section allows hospitals and health systems to analyze the medications used by physicians based on various patient populations. It also allows users to identify any potential over-utilization of pharmaceuticals. bThis tool can be accessed in Axiom Clinical Analytics Scorecards by adding the Pharmacy Analytics section to any scorecard.
Customizer Mode
When in Customizer Mode, you can move, rename, or delete the section.

Click the green check to exit Customizer Mode and start your analysis.

Analytic Options
- This section is profiles-based, so you can select your Profile, Profile Period, and Benchmark Profile (if you select an internal Benchmark Profile, you can also select the corresponding Period).
- The DRG icon below the profiles shows you the Grouping Type of your Profile.
- You can export this section's table to Excel by clicking the Excel icon in the top right corner.

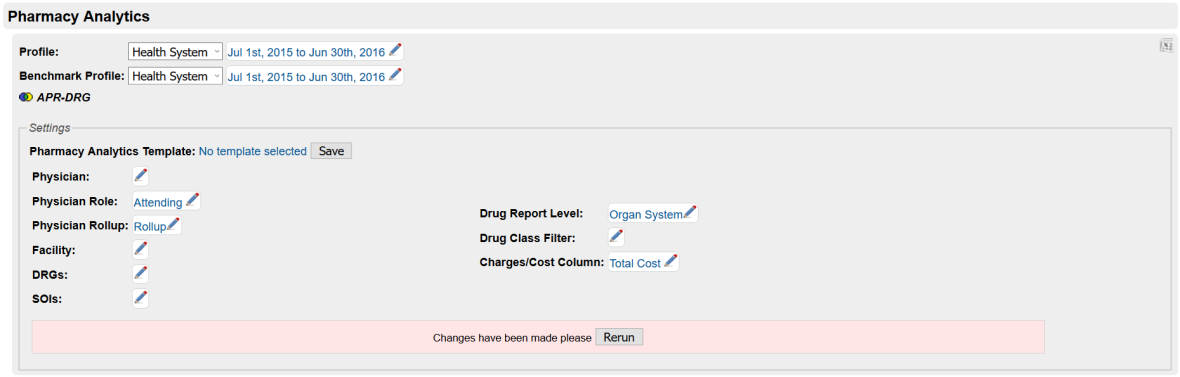
NOTE: All parameters in the Settings box are in addition to any filtering applied in the selected profile; keep this interaction in mind when analyzing data.
Pharmacy Analytics Template
This section offers Section-Specific Templates for you to save your settings; this saves you time and effort if you want to repeat your analysis later. Saving your parameters to the Template will preserve all of your selections in the Settings box, including the following settings:
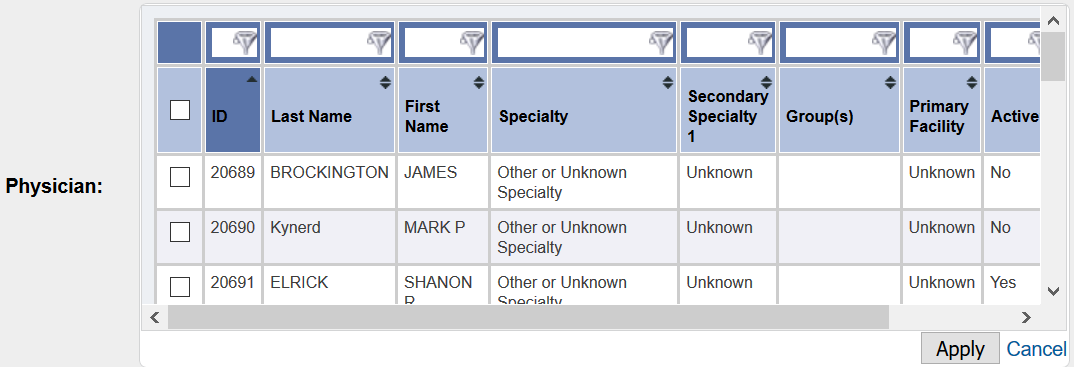
Physician
Choose one or more physicians from the searchable list; not selecting a physician will include all physicians in the data.
Physician Role
Select the Role that you would like to analyze; this will limit the patient encounters to only those with the physician(s) selected above acting in the role selected here.
Role options include:
- Attending
- Operating
- Other
- Consulting
- Ordering
Physician Rollup
This selection allows you to choose how the data are displayed in the table.
Options include:
-
Expanded: Displays one row per physician ID per line item
-
Rollup: All selected physician data are rolled up into one line of data for each analysis
Facility
If you would like to filter by facility, select one or more facilities to be included; not selecting any facilities will return data for all facilities.
DRGs
Select one or more DRGs from the searchable list; not selecting a DRG will include all DRGs. The DRG numbers will correspond with the DRG Type you selected.
SOIs
Select one or more SOIs from the searchable list; not selecting an SOI will include all levels of severity.
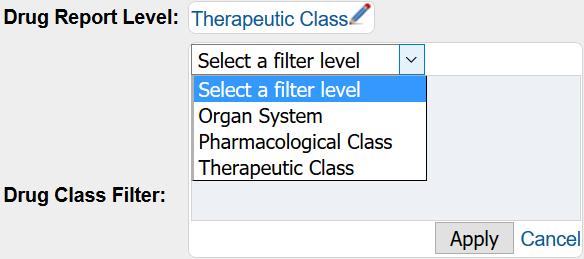
Drug Report Level
Clinical Analytics utilizes First Data Bank’s Pharmacy Hierarchy to organize and aggregate NDC pharmacy data into 6 levels of drillable analytic reports.
|
Report Level |
Definition |
Example 1 |
Example 2 |
|---|---|---|---|
|
Organ System |
Highest and broadest level of classification organized by the specific organ(s) the drug targets |
Cardiovascular System |
Anti-infecting Agents |
|
Pharmacological Class |
Provides information about the specific drug class within a target organ system |
Anti-hypertensives |
Antibiotics |
|
Therapeutic Class |
Describes the drug’s mechanism of action to accomplish the therapeutic goal within the assigned pharmacological class |
ACE Inhibitors |
Penicillins |
|
Generic Drug Name |
Identifies the drug’s “active ingredient” to accomplish the mechanism of action or therapeutic goal |
Captopril |
Amoxicillin |
|
Specific Generic Drug |
Describes the strength or concentration of the generic drug |
Captopril 25mg |
Amoxicillin 250mg |
|
National Drug Code |
The National Drug Code (NDC) is assigned at the specific drug level |
0143-1172-01 |
0143-9938-01 |
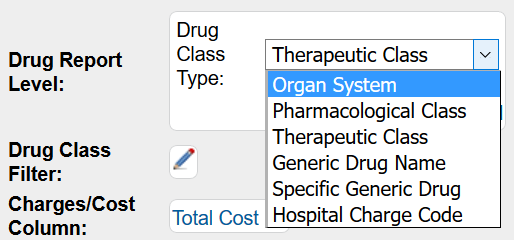
Drug Class Filter
Select one filter level, then select one or more filters from the searchable list; not selecting a filter will return all drug classes. The filter level drop-down options will change when you change the Drug Report Level; you will only be able to filter on one level at a time and only filter levels at or higher than your selected Drug Report Level will be available.
For example, when you select Therapeutic Class for your Report Level, your filter drop-down options include only Organ System, Pharmacological Class, and Therapeutic Class.
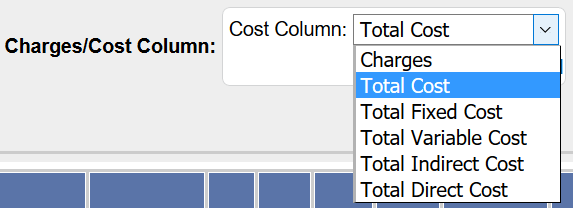
Charges/Cost Column
Select which value you would like displayed in the charges/costs column.
Report Column Definitions
Keep in mind that the column names are slightly different for each report level to provide you with the most applicable information for your analytics.
|
Column Name |
Definition |
|---|---|
|
Number of Cases |
Number of encounters with the same APR-DRG/SOI or MS-DRG as the cases that had a charge (see below) |
|
Number of Cases with Charges |
Number of encounters that had a charge for the specific CDM |
|
Number of Sys Cases |
Number of encounters in the benchmark group with the same APR-DRG/SOI or MS-DRG as the system cases that had a charge (see below) |
|
Number of Sys Cases with Charges |
Number of encounters in the benchmark group that had a charge for the specific CDM |
|
QTY (Quantity) |
Total number of times selected physician(s) had a charge for each description; counts multiples for days of room and board, medications administrations, etc. |
|
Sys QTY |
Total number of times benchmark group had a charge for each description; counts multiples for days of room and board, medications administrations, etc. |
|
Total Cost* |
Total cost for all cases associated with the selected physician(s) |
|
Sys Total Cost* |
Total cost for all cases associated with the benchmark group |
|
Average Quantity per Case |
Physician Average Quantity per Case: Quantity divided by the number of cases for the selected physician(s) |
|
Sys Avg Qty/Case |
System quantity divided by the number of system cases if you have one DRG and/or SOI chosen. If you have more than one DRG and/or SOI chosen, the average system quantity per case is weighted to match the case mix of the selected physician |
|
Percent of Cases Used |
Number of cases with charges divided by the number of cases for the selected physician(s) |
|
Sys % of Cases Used |
Number of system cases with charges divided by the number of system cases if you have one DRG and/or SOI chosen. If you have more than one DRG and/or SOI chosen, the system percent of cases used is weighted to match the case mix of the selected physician |
|
Diff % of Cases Used |
Difference between the system and physician percent of cases used |
|
Average Total Cost per Case* |
Total cost divided by number of cases for the selected physician(s) |
|
Sys Avg Total Cost/Case* |
Total cost divided by number of cases for the selected physician(s) |
|
Difference All Cases* |
Difference between the physician and system average total cost per case, multiplied by the number of cases and rounded to the nearest dollar |
*Column corresponds to your Charges/Cost Column parameter selection.